Motivation
The motivation behind undertaking this project on object extraction in satellite images stems from the increasing availability of high-resolution satellite imagery and the growing need for automated analysis of these vast datasets.
Satellite imagery provides a wealth of valuable information for various applications, including urban planning, environmental monitoring, disaster management, and agricultural assessment.
However, manually extracting objects of interest from these images is a time-consuming and labor-intensive task.
Dataset Overview
We have used the DOTA Dataset for our training our model.
This dataset consisted of around 1500 train images, 400 validation images and 400 testing images.
Bounding box coordinates of each image were present for the training and validation dataset.
There are multiple bounding boxes for each image

Dataset Visualization
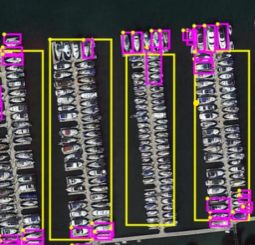
We have worked on a code to visualize and read all the bounding boxes on top of the image.
Apart from OBB, each instance is also labeled with a category.
The code returns a numpy array of the bounding boxes from all the images in the format shown below.
For eg. [x1,y1,x2,y2,x3,y3,x4,y4, category]

Dataset Visualization - Bar Graph

Image Splitting
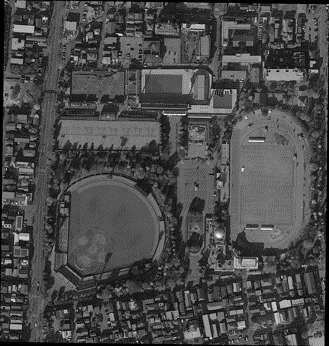
Sizes of the images vary from 5000 x 5000 to 20000 x 20000 pixels.
This makes the model computationally expensive, making Image Splitting an important step

Data Pre-Processing
Image Resizing
Before passing the images into the model, we have resized all the split images into 1024 x 1024 to keep the size parameter same across all the images.
Normalizing
Normalizing the coordinates is an important step. This step scales the image intensity values to familiar ranges.
Data Pre-Processing - Example

First Image before undergoing any preprocessing

Performance Metrics
The performance metric used is for this project is Mean Average Precision (MAP).
In order to get a clear understanding of MAP we need to understand Intersection of Union (IOU).
IoU measures the overlap between the predicted bounding box and the ground truth bounding box of an object, and is calculated as the ratio of the intersection area to the union area of the two boxes.
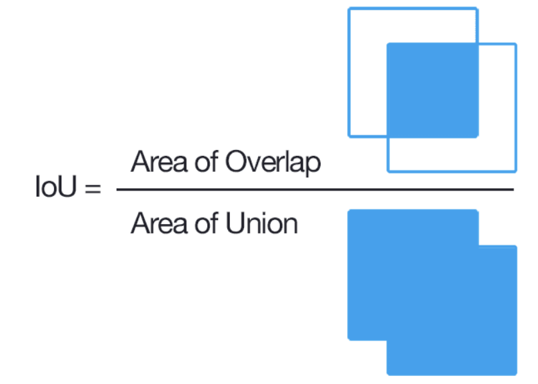
Image before passing to the model
Results
Loss Curve


Image after passing to the model with predictions