Numerical and Experimental Investigations on a Water Sprayed Fin and tube heat Exchanger
As part of this research, a two dimensional, numerical model for water and air interaction in cross flow has been developed based on mass and energy balance as well as convective heat and mass transfer relations, with transfer coefficients obtained from experimental correlations.
Also, a test facility has been set up to assess the performance of the modified heat exchanger. Experimentation was conducted on the plain as well as water sprayed fin and tube heat exchanger by maintaining a constant air flow rate of 300 CFM and a range of 150 to 600 LPH for hot water.
The temperature of hot water was varied from 50°C to 80°C. Results indicate that when the same heat exchanger is employed with water spray from its top, its heat duty is augmented due to enhanced values of the airside heat transfer coefficient.
Results indicate a 40 to 60% increase in heat duty and effectiveness of enhanced heat exchanger, for cooling water flow rates in the range of 150 to 450 LPH and airflow rate of 300 CFM.
Numerical Solution
A system of ordinary differential equations has been formed and solved using Runge-Kutta method with fourth-order accuracy and variable time step.
This numerical model was simulated for cool and humid (25°C and 75% RH), hot and less humid (33°C and 45% RH) conditions with and without a cooling pad. It was tested with air flow rates up to 3900 m3/hr and spray water flow rates up to 15 LPM. V
Volumetric heat and mass transfer coefficients required for simulating the model, have been obtained from the experimental correlations developed from experimental results. Results have been obtained by means of a computer code written in MATLAB.
Temperature and relative humidity (RH) of air and spray water temperature after exiting the control volume in the simulation results are compared with those of experimental results. The model has been tested for both climatic conditions during evaporative cooling as well as with and without a cooling pad.
The numerical model has been simulated to compare the variation of performance parameters for FCW unit with and without cellulose pads.
Pad thickness is considered as the width of air-water interaction in case of control volume (CV) with cellulose pad and water spray width across air flow in case of control volume without pad (100 mm in both cases).

Schematic for air-water interaction
Experimental Setup
The experimental setup consists of heat exchanger, rotameter, submersible pump, fan, temperature measuring unit and anemometer. The submersible pump is placed inside the open well filled with water. The outlet of the submersible pump is connected to the rotameter which is further connected to the inlet of heat exchanger via a hose tube. The water flows through the tubes of the heat exchanger and is collected in a separate water tub. The water spray unit is permanently fixed at the top of the heat exchanger. The heat exchanger is fixed to a separate stand made of mild steel tubes. The electrical connections for the fan, submersible pump, and the temperature indicator are connected to a single junction box. The junction box is connected to the electrical board. The heater rod is separately connected to the electrical board and is dipped into the water tub. A galvanized iron sheet duct is fixed to the heat exchanger to restrict the mixing of outlet air from the heat exchanger and the atmospheric air. Thermocouple A is fixed inside the duct close to the heat exchanger to measure the outlet air temperature. Thermocouple B has a small quantity of wet cotton covering the beading to measure the wet bulb temperature of the inlet and the outlet air. Thermocouple C is fixed at the exit of the heat exchanger to measure the inlet and the exit water temperature. Thermocouple D is fixed to the spray water setup to measure the spray water inlet temperature. Thermocouple E is fixed to the base of the heat exchanger to measure the temperature of the spray water outlet. Thermocouple F is used to measure the inlet air temperature. The ends of the thermocouple are connected to the temperature indicator. The anemometer is manually held at the exit of the duct to measure the velocity of the air.
Parameters measured
The various parameters that are measured during the experimentation with evaporative cooling are:
Flow rate of hot water.
Velocity of air.
Temperature of air inlet (T1)
Temperature of air outlet (T2)
Heat exchanger water inlet temperature (T3)
Heat exchanger water outlet temperature (T4)
Spray water inlet temperature (T5)
Spray water outlet temperature (T6)
Wet bulb temperature of inlet air (DBT1)
Wet bulb temperature of outlet air (DBT2)
Ambient temperature (T7)
For experiments without evaporative cooling, all the above parameters are measured except the spray water inlet and outlet temperature.


Experimental setup for testing the heat exchanger with evaporative cooling
Results and Discussion
Experimentation
Experimentation was conducted on the plain as well as water sprayed fin and tube heat exchanger by maintaining a constant air flow rate of 300 CFM and a range of 150 to 600 LPH for hot water. Temperature of hot water was varied from 50°C to 80°C. Both, temperature and flow rate of hot water were varied while testing the heat exchanger. Parameters viz., flow rate, inlet and outlet temperatures of water and air (dry bulb as well as wet bulb), inlet and outlet temperatures of spray water were measured.
Experimental values of heat duty and effectiveness for plain heat exchanger with respect to hot water flow rate and temperature are compared in Fig. 1 and Fig. 2, respectively. Overall heat transfer coefficient (U) which is a function of airside and waterside heat transfer coefficients increases with respect to hot water inlet temperature and flow rate because of high Reynolds number. In both cases, ‘U’ is more for water sprayed heat exchanger since airside heat transfer coefficient is enhanced by water spray. Similarly, heat rejection capacity of the heat exchanger also increases as hot water inlet temperature and flow rate increase, because of higher values of ‘U’. In both cases, heat duty is more for water sprayed heat exchanger due to enhanced overall heat transfer coefficient.

Figure 1. Effect of hot water inlet temperature and flow rate on plain exchanger heat duty

Figure 2. Effect of hot water inlet temperature and flow rate on plain exchanger effectiveness
Fig. 3 and Fig. 4 show similar trends for water sprayed heat exchanger. Effectiveness and heat rejection for the exchanger are enhanced due to evaporative cooling of air across the heat exchanger.

Figure 3. Effect of hot water inlet temperature and flow rate on water sprayed exchanger heat duty

Figure 4. Effect of hot water inlet temperature and flow rate on water sprayed exchanger effectiveness
Experimental values of heat duty and hot water outlet temperature for both heat exchangers are compared in Fig. 5 and Fig. 6, respectively. Due to enhanced performance by means of evaporative cooling of water spray over its tubes, hot water outlet temperature is reduced for water sprayed heat exchanger.

Figure 5. Performance comparison of plain and water sprayed heat exchanger

Figure 6. Comparison hot water outlet temperature for plain and water sprayed heat exchanger
Experimental values of dry and wet bulb temperature of outlet air for both heat exchangers are compared in Fig. 7 and Fig. 8, respectively. In case of water sprayed heat exchanger, when air flows over the tubes, it comes into contact with water spray which undergoes evaporative cooling, resulting in reduction in air outlet dry bulb temperature whereas outlet wet bulb temperature increases since moisture is transferred from water to air due to evaporative cooling.

Figure 7. Comparison outlet air dry bulb temperature for plain and water sprayed heat exchanger

Figure 8. Comparison outlet air wet bulb temperature for plain and water sprayed heat exchanger
Numerical Model
The numerical model has been simulated to compare the variation of performance parameters for evaporative cooling unit with and without cellulose pad. Pad thickness is considered as width of air-water interaction in case of control volume (CV) with cellulose pad and water spray width across air flow in case of control volume without pad (100 mm in both cases). Figure 9 compares the variation of spray water temperature when it flows from the top of CV with and without pad, during hot and less humid conditions. In the absence of pad, water surface coming into contact with air saturates faster at 13% of CV height since it reacts with more amount of air due to very little residence time between air and water. This hinders evaporative cooling whereas in the presence of pad, air-water interaction takes place uniformly in small compartments of pad and residence time is also more. Due to this, water surface saturates at 70% of the CV height facilitating better evaporative cooling. Figure 10 shows similar trends for cool and humid conditions. Cellulose pad is beneficial in these conditions since it slows the saturation of water surface throughout CV height thereby aiding improved interaction of air and water. Variation of air humidity across the width of control volume during hot and less humid conditions has been shown in Fig. 11. As discussed earlier (Fig. 9), since evaporative cooling is restrained because of little residence time, increase in air humidity is less when pad is not used. Also, it ceases increasing in the early stage of interaction. Humidity increase is improved because of better interaction, when pad is used. Also it continues to increase during the later stage of interaction. Figure 12 shows similar trends for cool and humid conditions. In the absence of cooling pad, decrease in air DBT is negligible even at low air and water flow dates during hot and less humid conditions (Fig. 13). This is due very little residence time available for air- water interaction. When pad is used, air DBT decreases by 3 to 5°C. It reduces more at low air velocities. As discussed earlier (Fig. 6.1), effective interaction between air water takes place because of increased residence time in the presence of pad. Similar trends observed for cool and humid conditions also (Fig. 14).

Fig. 9 Variation of absolute humidity of air along non-dimensional width of control volume during hot and less humid conditions
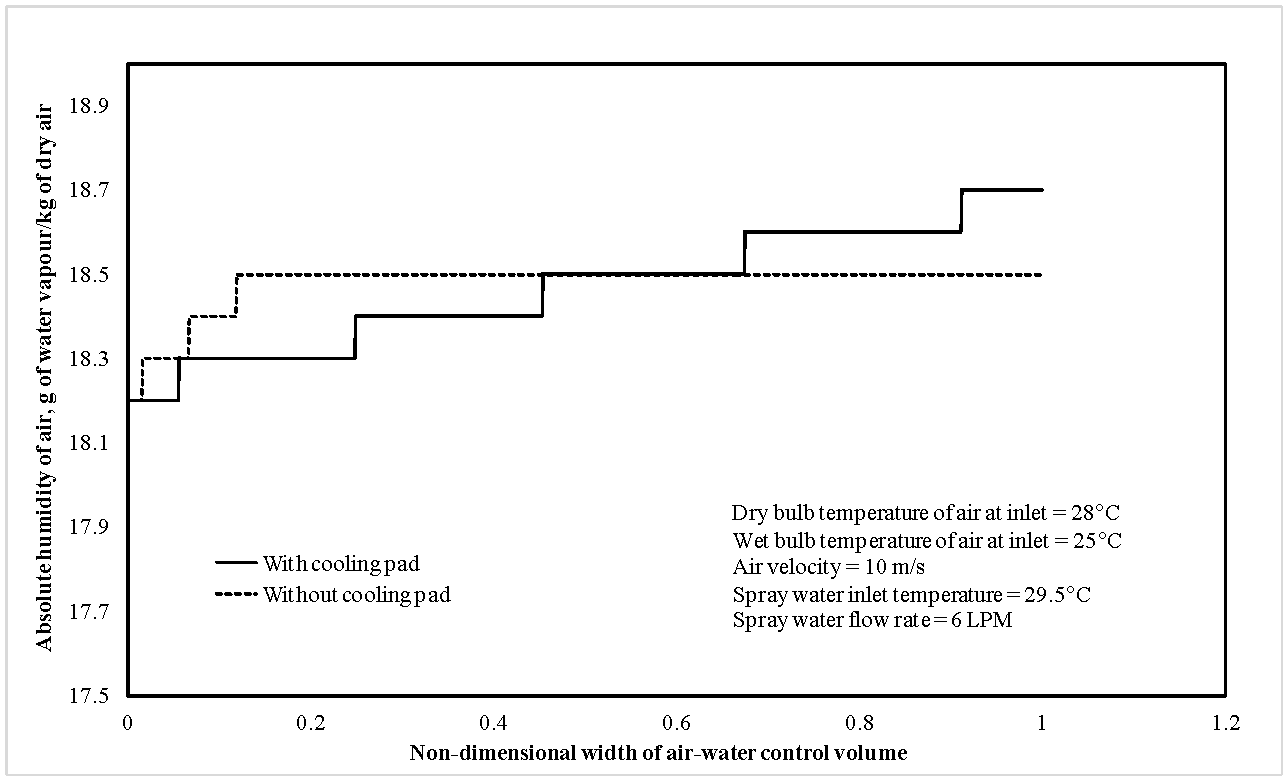
Fig. 10 Variation of absolute humidity of air along non-dimensional width of control volume during cool and humid conditions

Fig. 11 Variation of spray water temperature along non-dimensional height of control volume during hot and less humid conditions

Fig. 12 Variation of spray water temperature along non-dimensional height of control volume during cool and humid conditions

Fig. 13 Variation of air dry bulb temperature along non-dimensional width of control volume during hot and less humid conditions at different air velocities

Fig. 14 Variation of air dry bulb temperature along non-dimensional width of control volume during cool and humid conditions at different air velocities